Over the last few years I have use a combination of Rmarkdown and beamer to create slides for my teaching. Overall, I love the ability to abstract away from overly crufty beamer code and write in a more compact and natural way. The downside is that I often run into frustration trying to get some part of the slides just so.
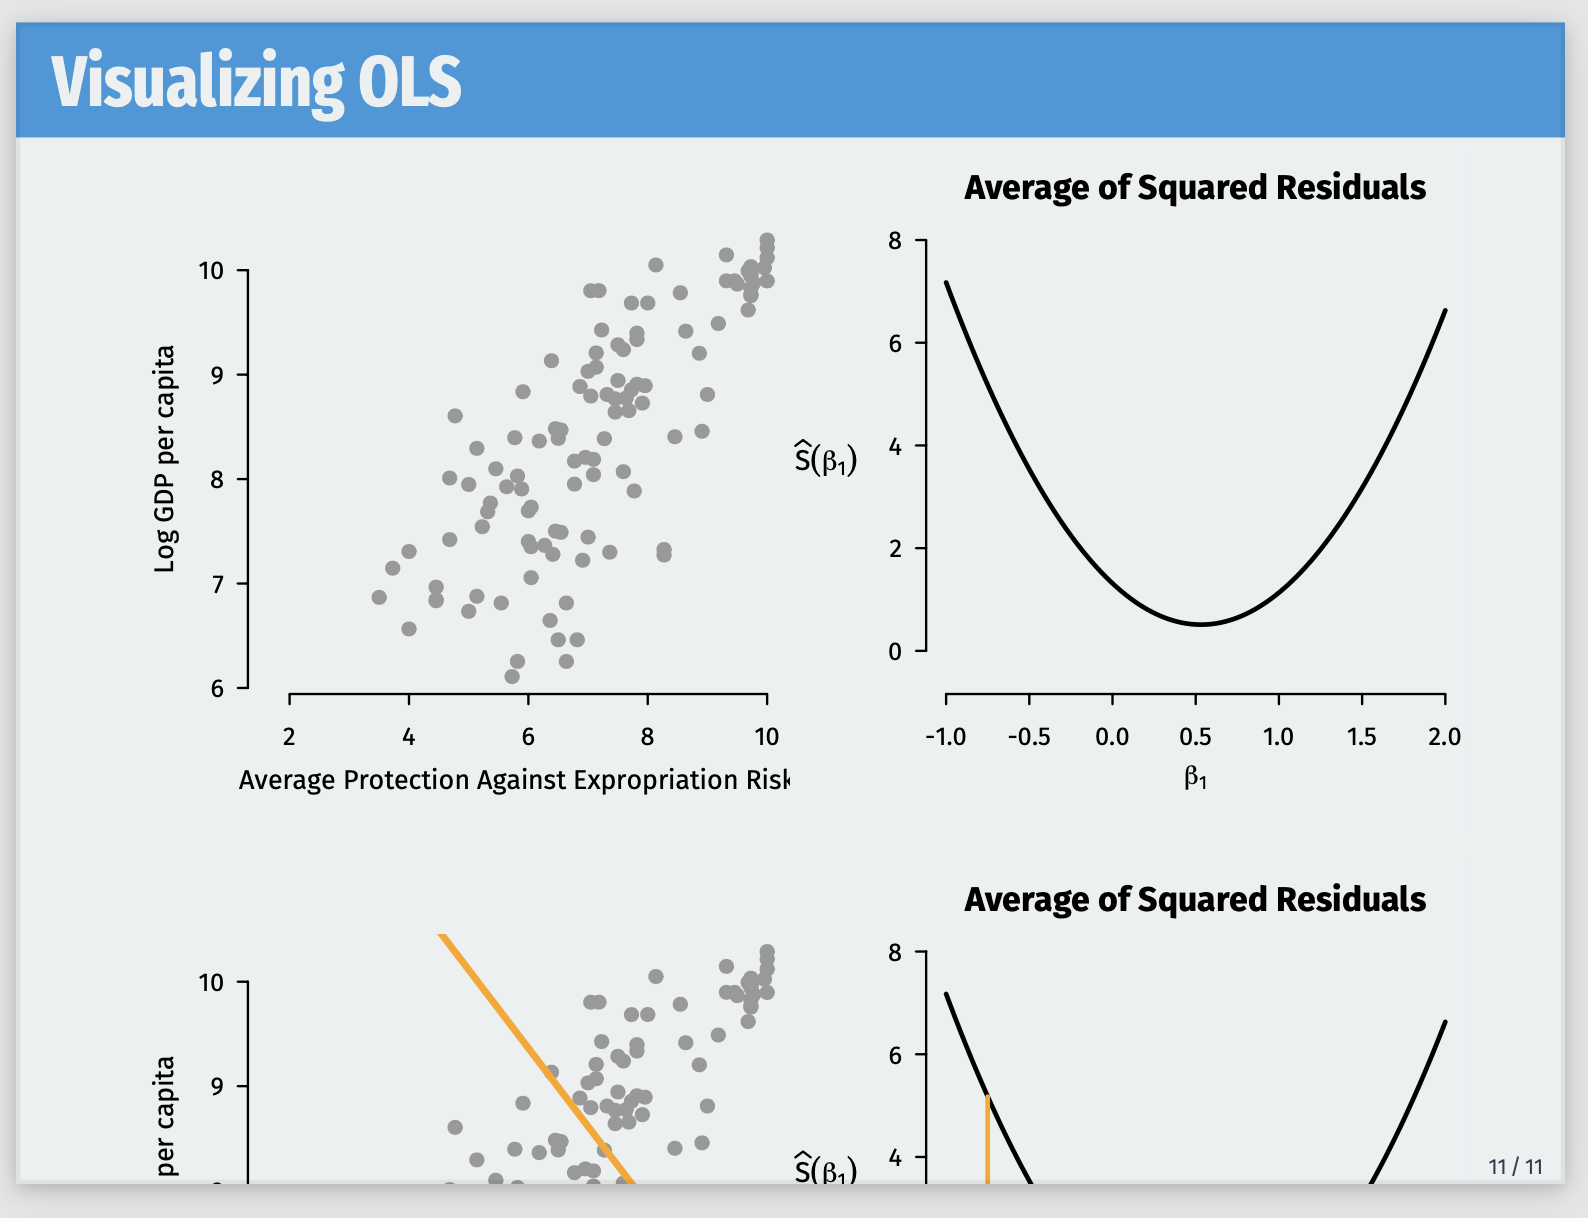
One such frustration comes with overlays for figures. Often, I want a single frame to contain multiple overlays with different PDF files replacing one another. A (moving) picture is worth a thousand words here, so this is the goal I’m trying to achieve:
In this short GIF, I just recorded myself paging up and down through the PDF presentation generated from beamer. Something like this can be generated with LaTeX and beamer with the following code:
\begin{frame}

\includegraphics<1>{fig1.pdf}
\includegraphics<2>{fig2.pdf}
\includegraphics<3>{fig3.pdf}

\end{frame}
This is a very useful way to produce animations that I can use to demonstrate key statistical ideas visually. I’m not sure how useful the students find them, but they definitely help me clarify and connect with the topic without having to produce a lot of animation overhead.
A final nicety of this approach is that you use a simple trick to select which of the figures you would like to be shown when producing handout versions of the slides. Handout versions of slide decks are essential for students who want to mark them up and take notes or just have them for a reference later. I use a Makefile to automate the creation of the handout and regular versions of the slides so I can present with “click-throughs” but my students can reference the handout. To select the pdf for the handout version, there’s a small trick:
\begin{frame}

\includegraphics<1| handout:0>{fig1.pdf}
\includegraphics<2| handout:0>{fig2.pdf}
\includegraphics<3| handout:1>{fig3.pdf}

\end{frame}
This code will select fig3.pdf as the figure to show on the handout version.
Trying and failing in RMarkdown
If you try to accomplish the same task in RMarkdown, things are much more difficult, out of the box. One option is to generate your plots in the same chunk:
## Frame title

```{r}
plot(x1, y1, main = "Overlay 1")
plot(x2, y2, main = "Overlay 2")
plot(x3, y3, main = "Overlay 3")
```
Unfortunately, this leads to a slide with each of the plots is stacked vertically with no overlay:
The second hack is to simply put each of the overlay plots in a separate frame:
## Frame title

```{r}
plot(x1, y1, main = "Overlay 1")
```

## Frame title

```{r}
plot(x2, y2, main = "Overlay 2")
```

## Frame title

```{r}
plot(x3, y3, main = "Overlay 3")
```
This has a number of drawbacks. First, it is horrendously ugly and contains a lot of code copying. Second, this will increment the frame number on each overlay, which somewhat defeats the whole point of having the overlay in the first place. There are tricks to get around this, but none of them solve the last problem, which is that there is no way to select what frame should be shown in the handout version using RMarkdown (or really, pandoc since that’s what actually does the markdown -> latex conversion). Every time I went to make one of these, I ran into these fairly minor paper cuts.
Hooked on Hooks
After a while, the paper cuts become too much and I was ready to automate the process. This meant looking into the hooks system of knitr which is the core engine that processes the R chunks in an Rmd file to produce source, output, and plots in the document. I thought it would be a massive undertaking, but it turned out to be just a few lines of code to modify the plot hook. It looks like this:
hook_plot <- knitr::knit_hooks$get("plot")
knitr::knit_hooks$set(
  plot = function(x, options) {
    if (is.null(options$overlay.plot)) {
      return(hook_plot(x, options))
    } else {
      i <- options$fig.cur
      hand <- as.numeric(ifelse(i == options$overlay.plot, 1, 0))
      bf <- paste0("\\only<", i, "| handout:", hand, ">{")
      paste(c(bf, knitr::hook_plot_tex(x, options), "}"), collapse = "\n")
    }
  }
)
What does this do? It first saves the default plot hook so we can leverage it later. Then it replaces the plot hook with one that depends on the chunk option overlay.plot. If that option is NULL (the default), you just run the normal plot hook. If it’s set to a number, say overlay.plot = 2, it will wrap each plot in an \only<i| handout:x>{} statement, where i is the figure number (in order that the chunk produces them) and x will be 1 on the 2nd figure and 0 otherwise. Thus, overlay.plot selects the figure number that should be shown on the handout slide.
With this, we can turn this Rmd source
## Frame title

```{r fig, overlay.plot = 3}
set.seed(12345)
x1 <- runif(100)
y1 <- rnorm(100)
cuts <- c(0, 0.25, 0.5, 0.75, 1)
for (i in seq_along(cuts)) {
  cols <- ifelse(x1 <= cuts[i], "indianred", "grey80")
  plot(x1, y1, col = cols, pch = 19)
  abline(v = cuts[i], lwd = 3, col = "indianred")
}
```
into something like this beamer code:
\begin{frame}{Frame title}
\only<1| handout:0>{
\includegraphics{fig-1}
}
\only<2| handout:0>{
\includegraphics{fig-2}
}
\only<3| handout:1>{
\includegraphics{fig-3}
}
\only<4| handout:0>{
\includegraphics{fig-4}
}
\only<5| handout:0>{
\includegraphics{fig-5}
}
\end{frame}
The actual tex output is more complicated in uninteresting ways. If you are interested in playing around with this your self, I posted a gist of a minimal working example and I have also posted the PDF output of the example.